SIPOC diagram
The SIPOC diagram, which stands for Suppliers, Inputs, Process, Outputs and Customers is a simple yet powerful diagram that illustrates how a Six Sigma process works from beginning to end.
This five-column structure clarifies the process’s boundaries before starting a Six Sigma project, identifies the stakeholders and provides a quick overview of the elements that add and detract from value throughout the process. This allows the team managing the process to understand at a glance which inputs translate into which outputs and who is affected by them.
CTQ Trees
The CTQ (Critical to Quality) tree is used to translate customer needs (voice of the customer) into measurable quality requirements.
At the top of the tree are customer expectations, in the middle are critical quality factors, and at the bottom are specific metrics for measuring these factors. The CTQ method translates uncertain demands into numerical targets and provides a clear roadmap for the team managing the Six Sigma project. It helps express what the customer truly wants using technical terms.
Process mapping, Value stream mapping
Process mapping allows all steps of a workflow to be displayed and visualized sequentially. Process maps are an ideal method for identifying potential delays, bottlenecks, unnecessary steps, or repetitive work.
Value Stream Mapping is widely used in Lean Six Sigma implementations and aims to reduce waste by separately identifying steps that add value to the customer’s business and those that do not. This visualization allows the process management team to more easily identify and address areas for improvement.
Pareto analysis, 5 whys, Fishbone (Ishikawa)
These three tools are used together to identify root causes.
Pareto analysis is based on the 80/20 rule, which reveals that 80% of problems are caused by the root causes of the 20%, and it indicates which problems should be prioritized for resolution.
The 5 Whys technique relies on asking the question “Why?” five times in succession to get to the root of the problem.
The Fishbone (Ishikawa) diagram presents potential causes in a visual fishbone format, categorizing them into categories such as equipment, methods, materials, people and the environment.
The combination of these three methods creates a powerful framework needed to delve deeper into complex problems.
FMEA analysis
Failure Mode and Effects Analysis is developed to systematically analyze where and how errors can occur in a process, product, or service.
For each potential failure point, a probability, severity, and detectability score is assigned, calculating the RPN (risk priority number). This score indicates which errors should be addressed first. FMEA analysis is frequently used, particularly in industries with high failure costs, such as healthcare, aviation, and automotive.
Control charts, Hypothesis testing, Regression analysis
Statistical methods are the foundation of Six Sigma’s principle of data-driven decision making.
- Control charts monitor a process over time, distinguishing between normal variation and special-cause deviations.
- Hypothesis testing examines whether there is a statistically significant difference between two data sets or process variables.
- Regression analysis models the relationships between variables to determine which factors most significantly impact the process.
These techniques ensure that actions are based on evidence, not just human intuition.
This article covers the following topics. Click on the title you are interested in to access the article.
- The main objectives of Six Sigma
- Six Sigma methodology with the DMAIC approach
- The most common Six Sigma tools and methods
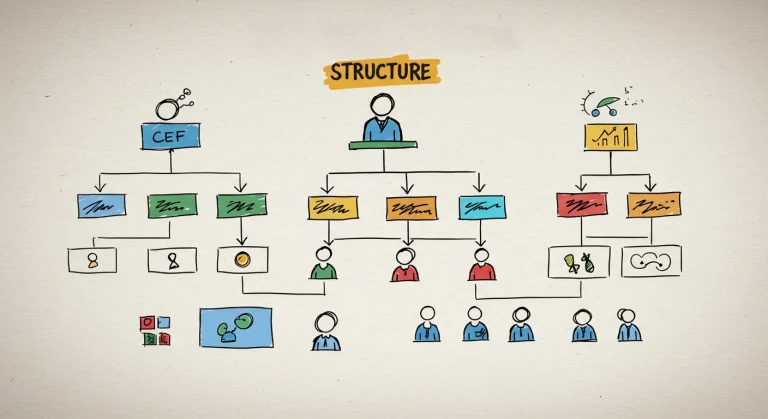
- Roles in Six Sigma
- Application areas of Six Sigma
- Possible difficulties in Six Sigma projects
Main photo by A Chosen Soul on Unsplash